

Pool Hashrate Below the Rating? Read Averages and Uptime
For a fluctuating short-term figure, first check freshness and whether the longer average also stays low. If an individual worker stops submitting work or its curve remains interrupted, send the site the timestamps and records rather than waiting a full day.
Practice with one set of public Demo values below. No account login or repair knowledge is needed to describe the issue clearly.
Rated at 892T, averaging 871T: start with the labels
The Hub Demo homepage checked on 2026-09-14 shows two A2 Hydro units rated at 892 TH/s together, current hashrate 878 TH/s, a 24-hour average of 871 TH/s and “updated 12 minutes ago.” It explicitly uses fictional static data, so that relative timestamp is also display text, not a live monitoring signal. Open the public Demo ↗
Locate rated and average hashrate, then the update time. 871 / 892 is about 97.65%, the average hashrate relative to rating. The separate 98.9% uptime figure is a different metric; its sampling method is not defined in the public Demo. For your own records, ask the site how uptime is measured before comparing the two.
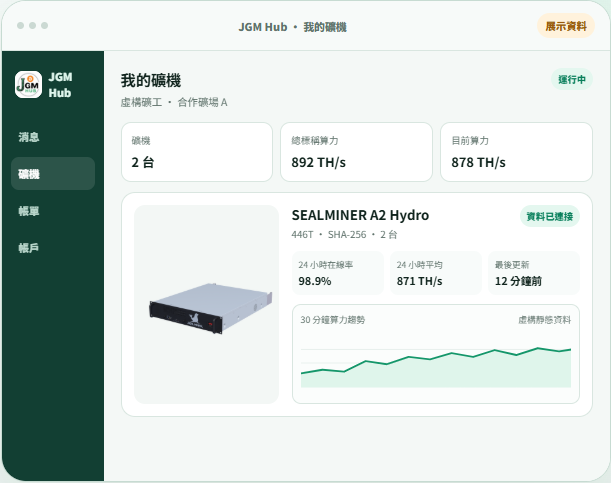
Learn and Hub are both part of JGM. For a real site, ask whether its uptime metric uses equipment connection time, successful monitoring samples or average hashrate. Align definitions before comparing months.
A pool estimates work; shorter windows fluctuate more
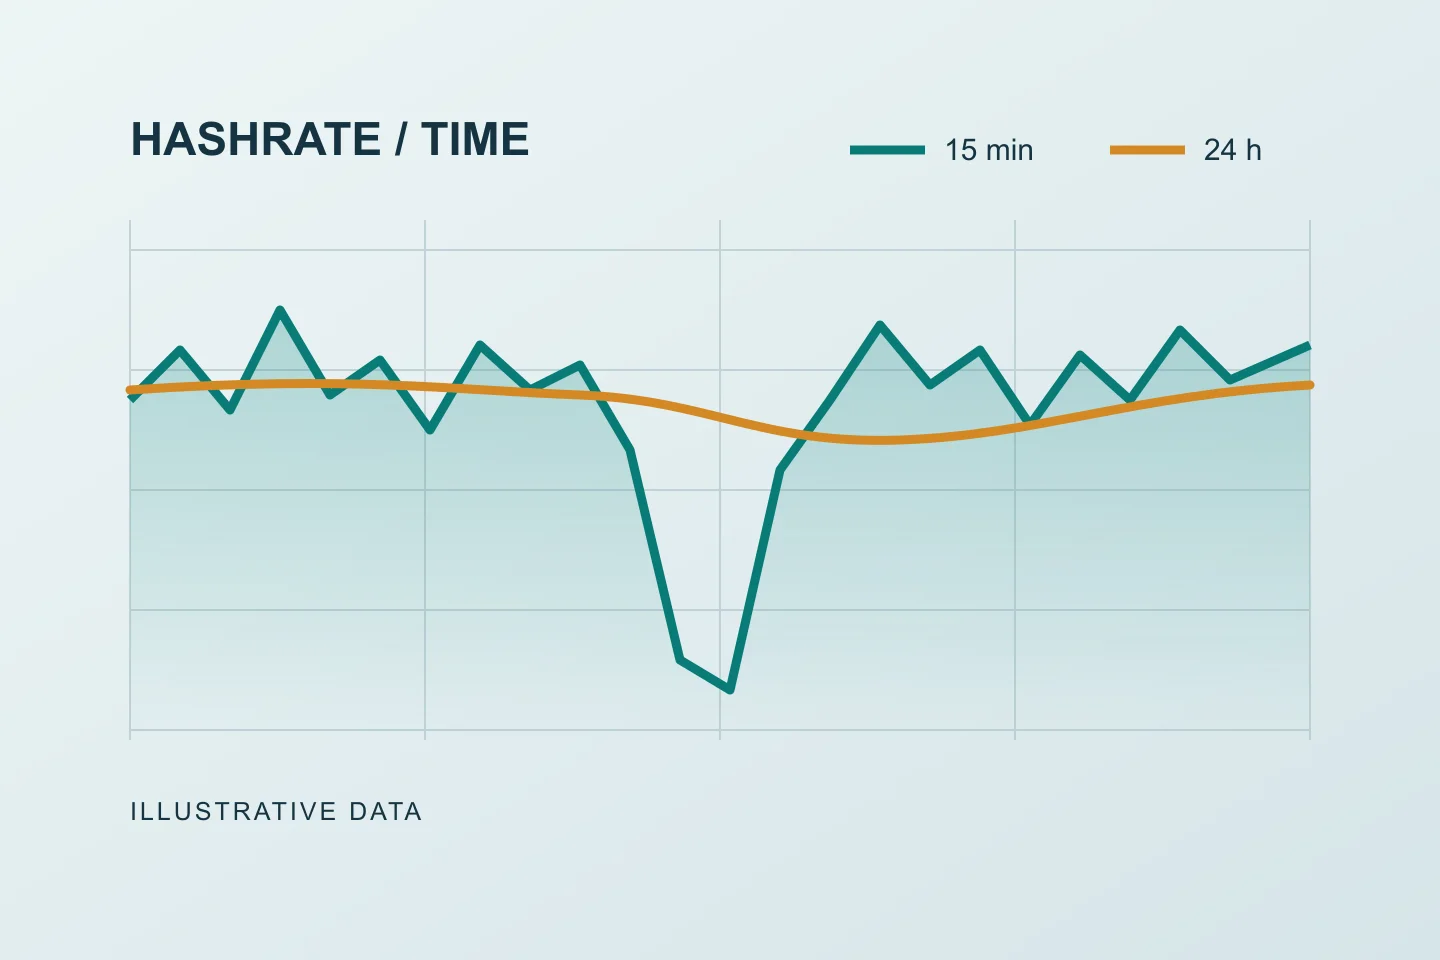
The local miner reports device-side performance, while the pool estimates hashrate from accepted work over a time window. Submitted work varies over short intervals, so a 15-minute average moves more than a daily average. f2pool likewise uses the short window as a connection reference and the longer window to assess performance. f2pool: hashrate measurement windows ↗Check rated specifications on the S21 XP page ↗
Braiins documents separate 5-minute, 60-minute and 24-hour averages and the last accepted-work timestamp. Read the window on an observer page. A recent drop with an otherwise steady daily average calls for checking a restart first; sustained weakness across both windows calls for investigating individual workers. Braiins: monitoring fields and timestamps ↗
A daily average includes earlier interruptions. After recovery it takes time for low values to roll out of the window. Conversely, a healthy daily average can hide a very recent outage; check recent submissions and the short-window curve too.
Follow a sequence that produces a useful report
Back to the 871T example: one average cannot identify the cause. Confirm the site and equipment group, check freshness, then locate the interval where the curve drops. This is an investigation sequence, not a universal percentage threshold.
- Check freshness, timezone and measurement window
- Compare the longer average with the recent curve
- Locate the affected worker identifier
- Match shutdown, maintenance or curtailment records
- Check the firmware version, last update time, control-board model and error logs
- Send timestamps and screenshots to the site
A worker is an identifier used by the pool. Whether it corresponds to one physical machine depends on site configuration; one name can represent several units. Confirm that mapping before identifying a specific faulty machine.
If the dip matches announced maintenance, ask whether recovery is complete. If a worker continues submitting nothing with no notice, report it promptly. If work continues at a persistently lower level, include rejected-work information and the curve, and ask the site to check networking, operating mode, temperature and equipment rather than guessing a failed hashboard.
If an issue starts after a firmware update, send the site the current version, update time, control-board model and error logs from the same interval. These records help identify known version issues; an error code alone cannot establish a software or hardware fault. Ask the site to confirm compatibility, maintenance arrangements and the recovery result.
Specific example (official release notes checked 2026-10-01): Braiins OS 26.09.1, released on 2026-09-24, is described as fixing T5 temperature-sensor errors on some Antminer S19/S21 miners after upgrading to Braiins OS 26.09. The issue caused intermittent 60-second mining halts. This is the vendor’s fix description, not a hardware test by Learn. Compare it only when the miner already uses that firmware and has matching symptoms; it does not identify the cause of every T5 error or recommend changing firmware across an entire fleet. Official Braiins OS release notes ↗
Compare daily averages across weeks and months
Track completed daily average hashrate using one timezone and equipment group. Comparing the last 7 and 30 days reveals sustained performance better than a momentary dip. If only a rolling 24-hour value is available, observe at a consistent time and keep that definition separate from completed calendar days.
For illustration, a group averaging around 230T daily that dips to 180T for one day and recovers calls for checking that day’s maintenance. Several consecutive days near 180T warrant investigation. Adjust the rated baseline when equipment is added or removed.
f2pool hashrate transfer: reading a smoother curve
f2pool lets a sender configure a receiver, transfer period and hashrate. The receiver can view incoming-transfer details on the worker page. This represents allocated hashrate rather than necessarily the submissions of one physical miner. Official documentation checked 2026-09-14. f2pool hashrate transfer documentation ↗
With a fixed allocation, sufficient supplying hashrate and continuous delivery, the receiver curve may approach a flat line. Focus on average daily received hashrate, coverage of the agreed period and continuing revenue records. Not every site offers transfers; first identify whether the account receives direct mining work or an allocation.
If a page shows “offline,” inspect incoming-transfer details, freshness, daily average and revenue records. When allocation and crediting continue, ask the site or f2pool to check the status display. If the underlying records also stop updating, investigate an interruption.
If long-term hashrate is stable but earnings fall, check difficulty and price. Verify delivered hashrate and accumulated BTC separately. Normal hashrate but lower earnings? ↗When do earnings reach the wallet? ↗